Advanced Custom Reports
Samsara
Our custom reporting tool was missing key datasets and granular customization features.
Physical operations are powered by big data. Samsara customers use it to make critical decisions – financial, employee performance, compliance, operations.
Building for product growth
Samsara wanted to build advanced custom reporting capabilities for a new premium license tier, unlocking additional revenue while increasing product stickiness. By significantly expanding beyond competitors’ limited reporting options, it would strengthen our position in the market.
We also wanted to bring custom reports to parity with the data available across the rest of the platform and build a scalable, flexible framework.
Narrowing down personas gave focus
Initially we targeted a broad range of users who had different levels of savviness around how to analyze data. The spectrum ranged from execs who just wanted to view high level trends to data analysts who wanted to dive deep in to manipulating data. Each persona type had different definitions of what made a good experience. From customer research, I saw that more intermediate skilled users, such as director-level roles were our most likely early adopters and had the greatest influence over purchasing decisions. I focused on meeting the expert where they are, while up leveling the beginner.
Creating a report
Choosing a dataset
To allow users to build any report they wanted, we provided an expanded list of preset datasets to build reports from. Each dataset had a template to avoid starting with a blank slate.
Adding a column
I designed a search-based workflow with rich descriptions and meta-data, so users could easily find the fields they wanted.
Filtering
Previously, users were missing the ability to create custom filters based off of the fields in the table. I added the ability to add filters from their respective columns. Later we would add in conditional filters where filters could be combined together.
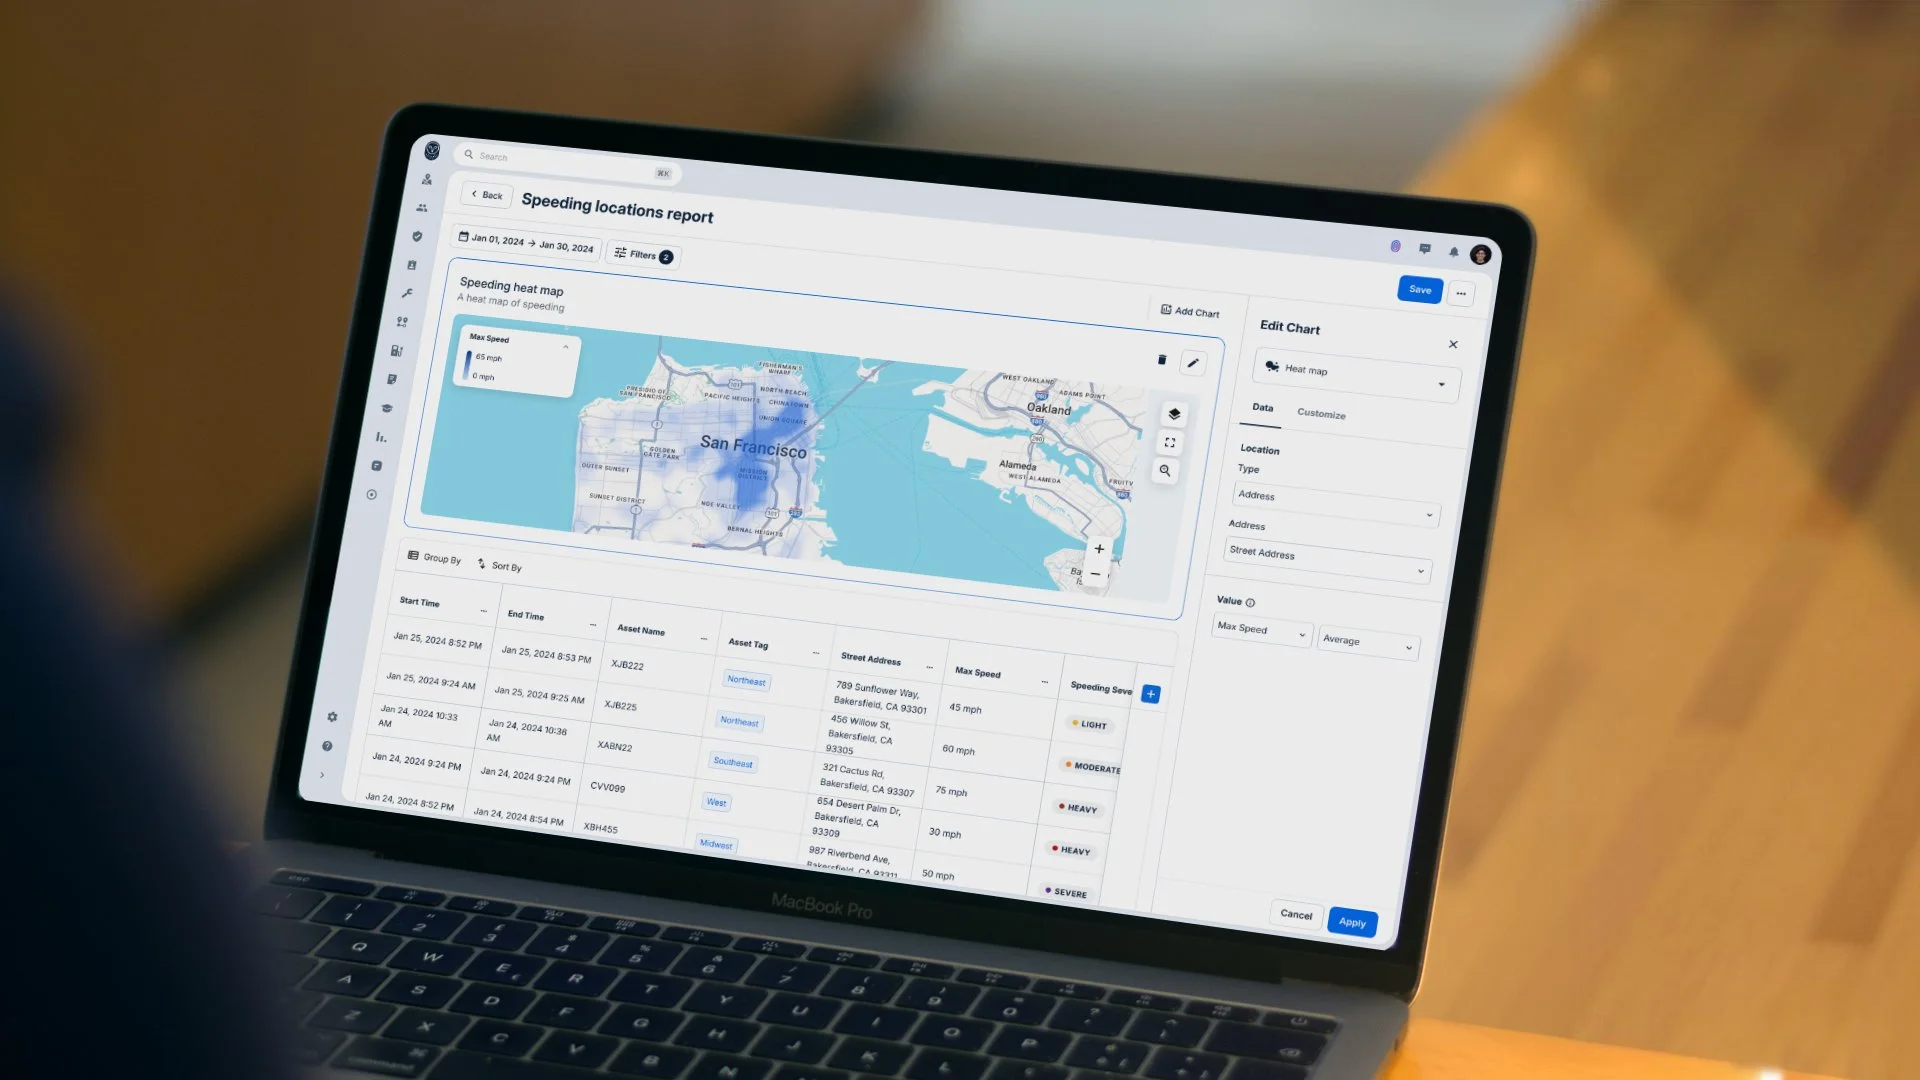
Data visualization
Charts help users identify trends and spot anomalies. I added in the ability to create data visualizations. Users could customize them with different color palettes to match their organization’s brand. Later we would add in the ability to create custom maps.
The results
20x
the previous version’s usage
96%
of 1M+ ARR customers using ACR – proving new product stickiness
Next case study